
Guide
Flowchart examples: algorithms and business processes
Flowchart examples show the steps of an algorithm or process with standard symbols: an oval for start and end, a rectangle for each step, a parallelogram for input and output and a diamond for decisions. Here are six classic algorithms, including the largest of three numbers, and three real-world processes, each explained step by step and ready to open in flowdraft.
How to use these flowchart examples
Each example has the diagram, a short explanation and, for algorithms, the numbered steps written before drawing. The Open this example in flowdraft button under each diagram loads it into the editor, where you can change anything. Editing needs no account; your drawing stays on your device as a draft. Exporting it as PNG, SVG or JSON requires a free account.
Examples 1 to 6 are the algorithm flowchart examples commonly set in programming classes; 7 to 9 are the kind of process flowcharts online shops, support teams and software teams draw. New to flowcharts? Start with what a flowchart is.
Symbols used in these flowchart examples
All examples here use five basic symbols, and a few add a blue annotation note; document, database, connector and the rest are in flowchart symbols.
Start / End
Where the flow begins and ends.
In flowdraft: The Start / End part in the palette; double-click it to edit the text.
Process
A calculation or task, such as SUM = SUM + i.
In flowdraft: A Step card: the action in the title, the formula in the subtitle.
Input / Output
Reading data from the user or printing a result.
In flowdraft: There is no parallelogram shape: use a Step card tagged INPUT or OUTPUT with a pen or screen icon.
Decision
A yes/no question, usually with two exits.
In flowdraft: The Decision part. Type the question, then click each outgoing line and label it Yes or No.
Flow line
The order of the steps; in a loop it points back to the decision.
In flowdraft: Drag from a dot on a box's edge to another box; click the line to set its color, style and label.
Example 1: Even or odd number (algorithm flowchart)
The first exercise in most algorithm classes. A number is even if dividing it by 2 leaves a remainder (mod) of 0, and odd if it leaves 1.
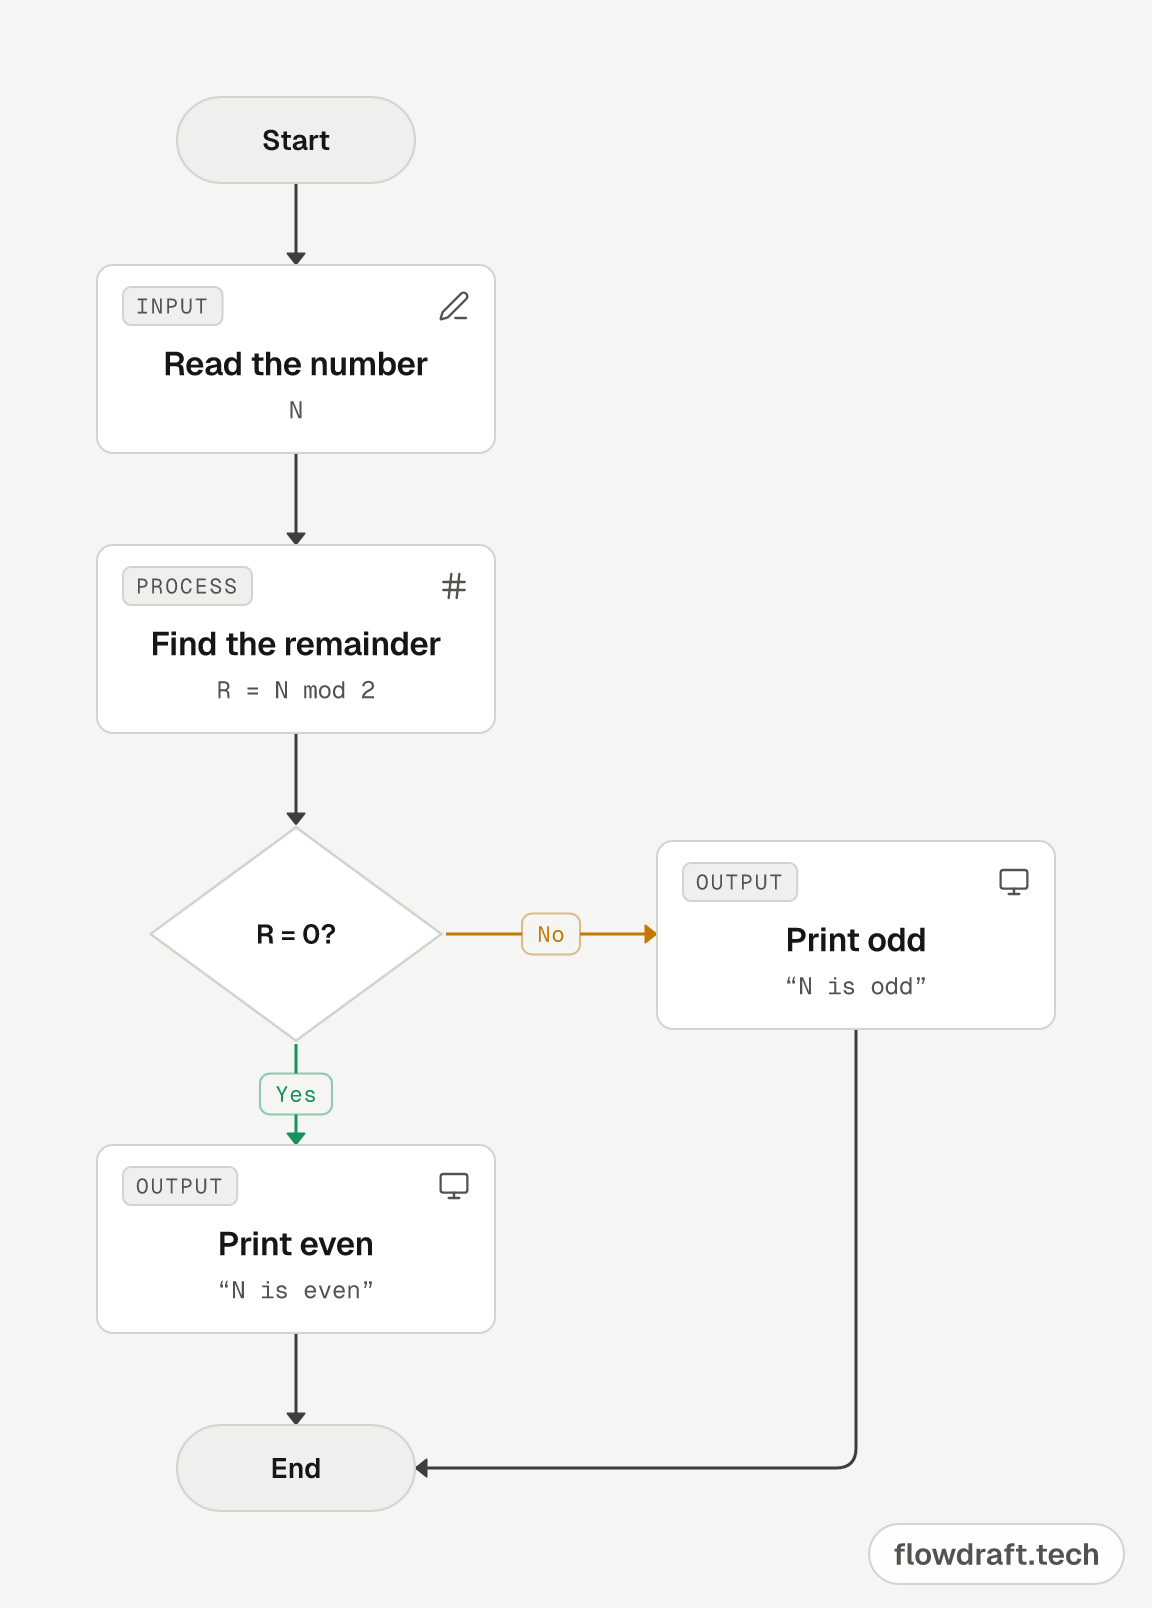
Algorithm
- Step 1: Start
- Step 2: Read N
- Step 3: R = N mod 2
- Step 4: If R = 0, print “N is even”, otherwise print “N is odd”
- Step 5: End
Walkthrough with N = 7
- 7 mod 2 = 1, so R = 1.
- R = 0? No, so the flow takes the right-hand branch.
- “7 is odd” is printed and the flow ends.
Example 2: Find the larger of two numbers
Two inputs, one comparison, two outputs. Watch the tie: when A = B, “A > B?” is answered No and B is printed. That is still correct; to print “equal” instead, add a second decision.
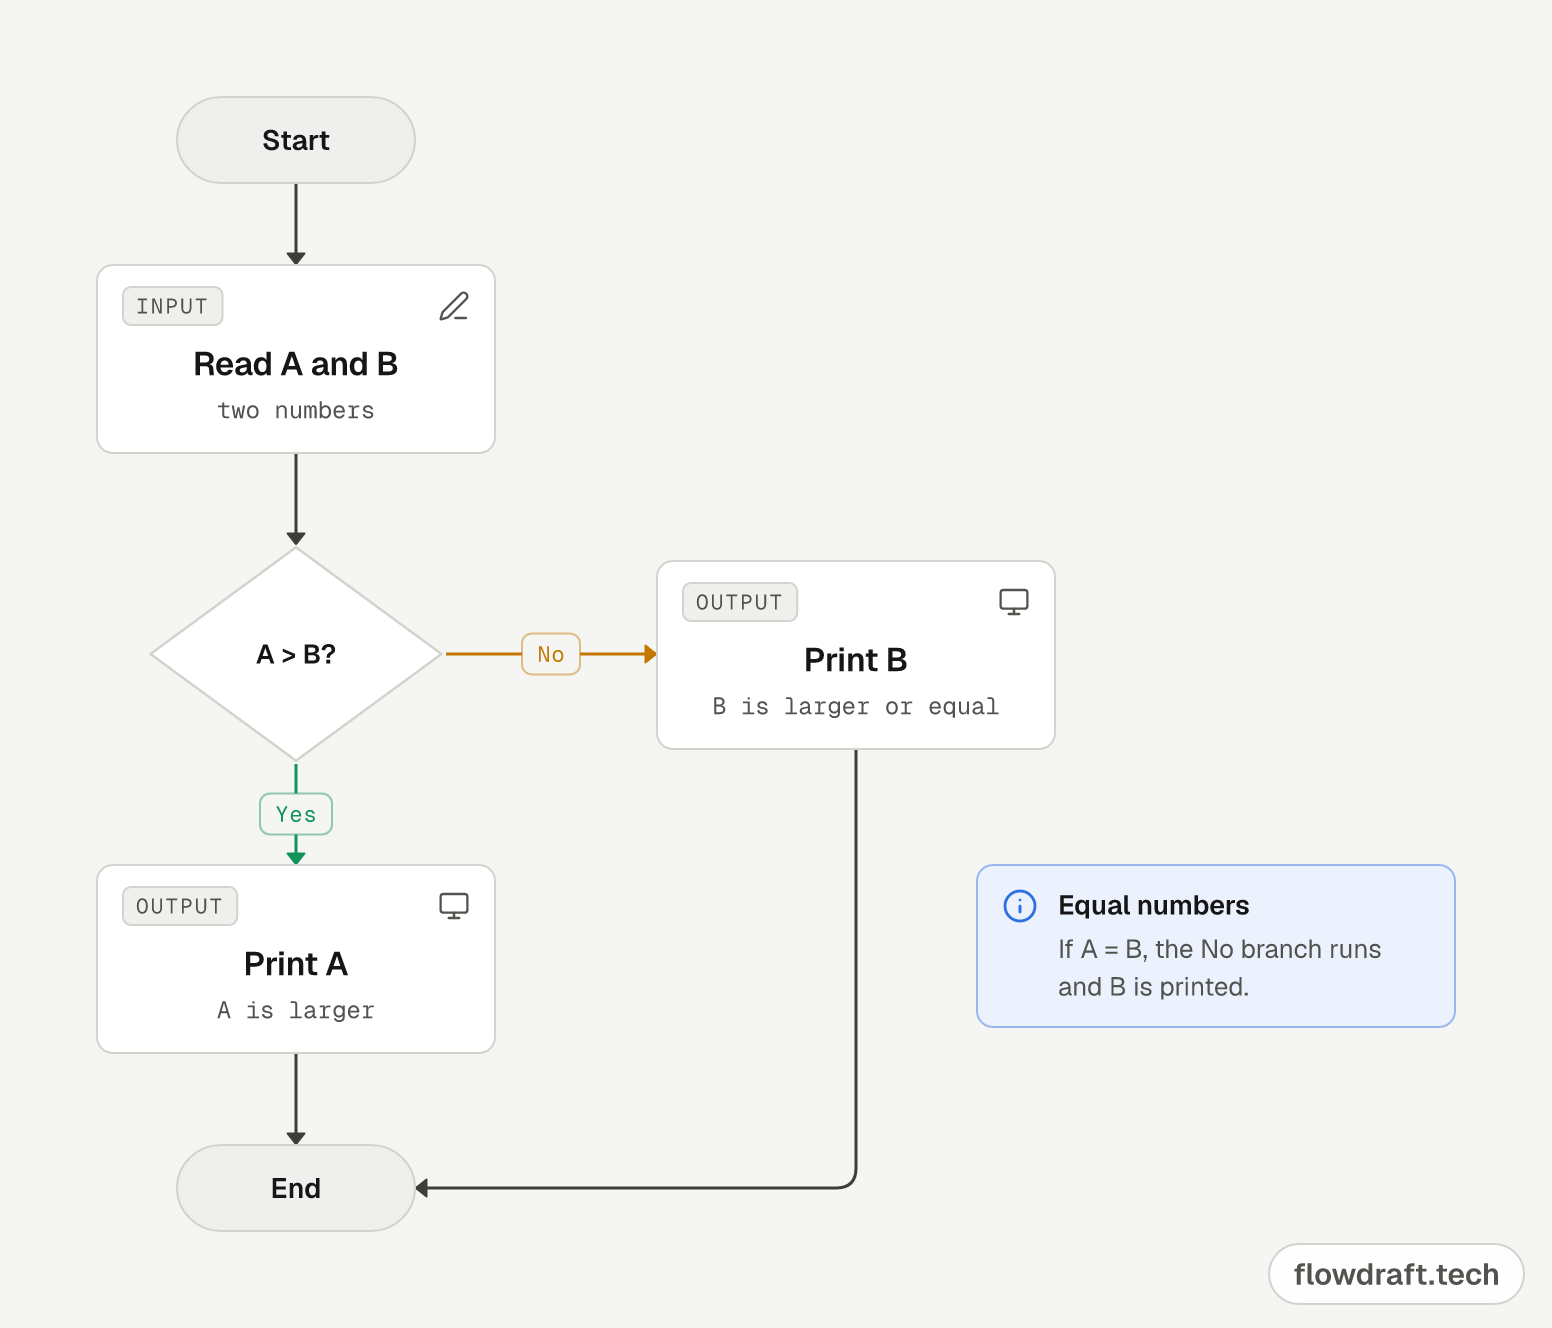
Algorithm
- Step 1: Start
- Step 2: Read A and B
- Step 3: If A > B, print A, otherwise print B
- Step 4: End
Walkthrough with A = 4, B = 9
- 4 > 9? No.
- The right-hand branch prints 9.
- The flow ends.
Example 3: Find the largest of three numbers
The classic exercise “draw a flowchart to find the largest of three numbers”. The first decision compares A and B, and the larger one is then compared with C. The chart has three decisions, but every path through it asks only two questions.
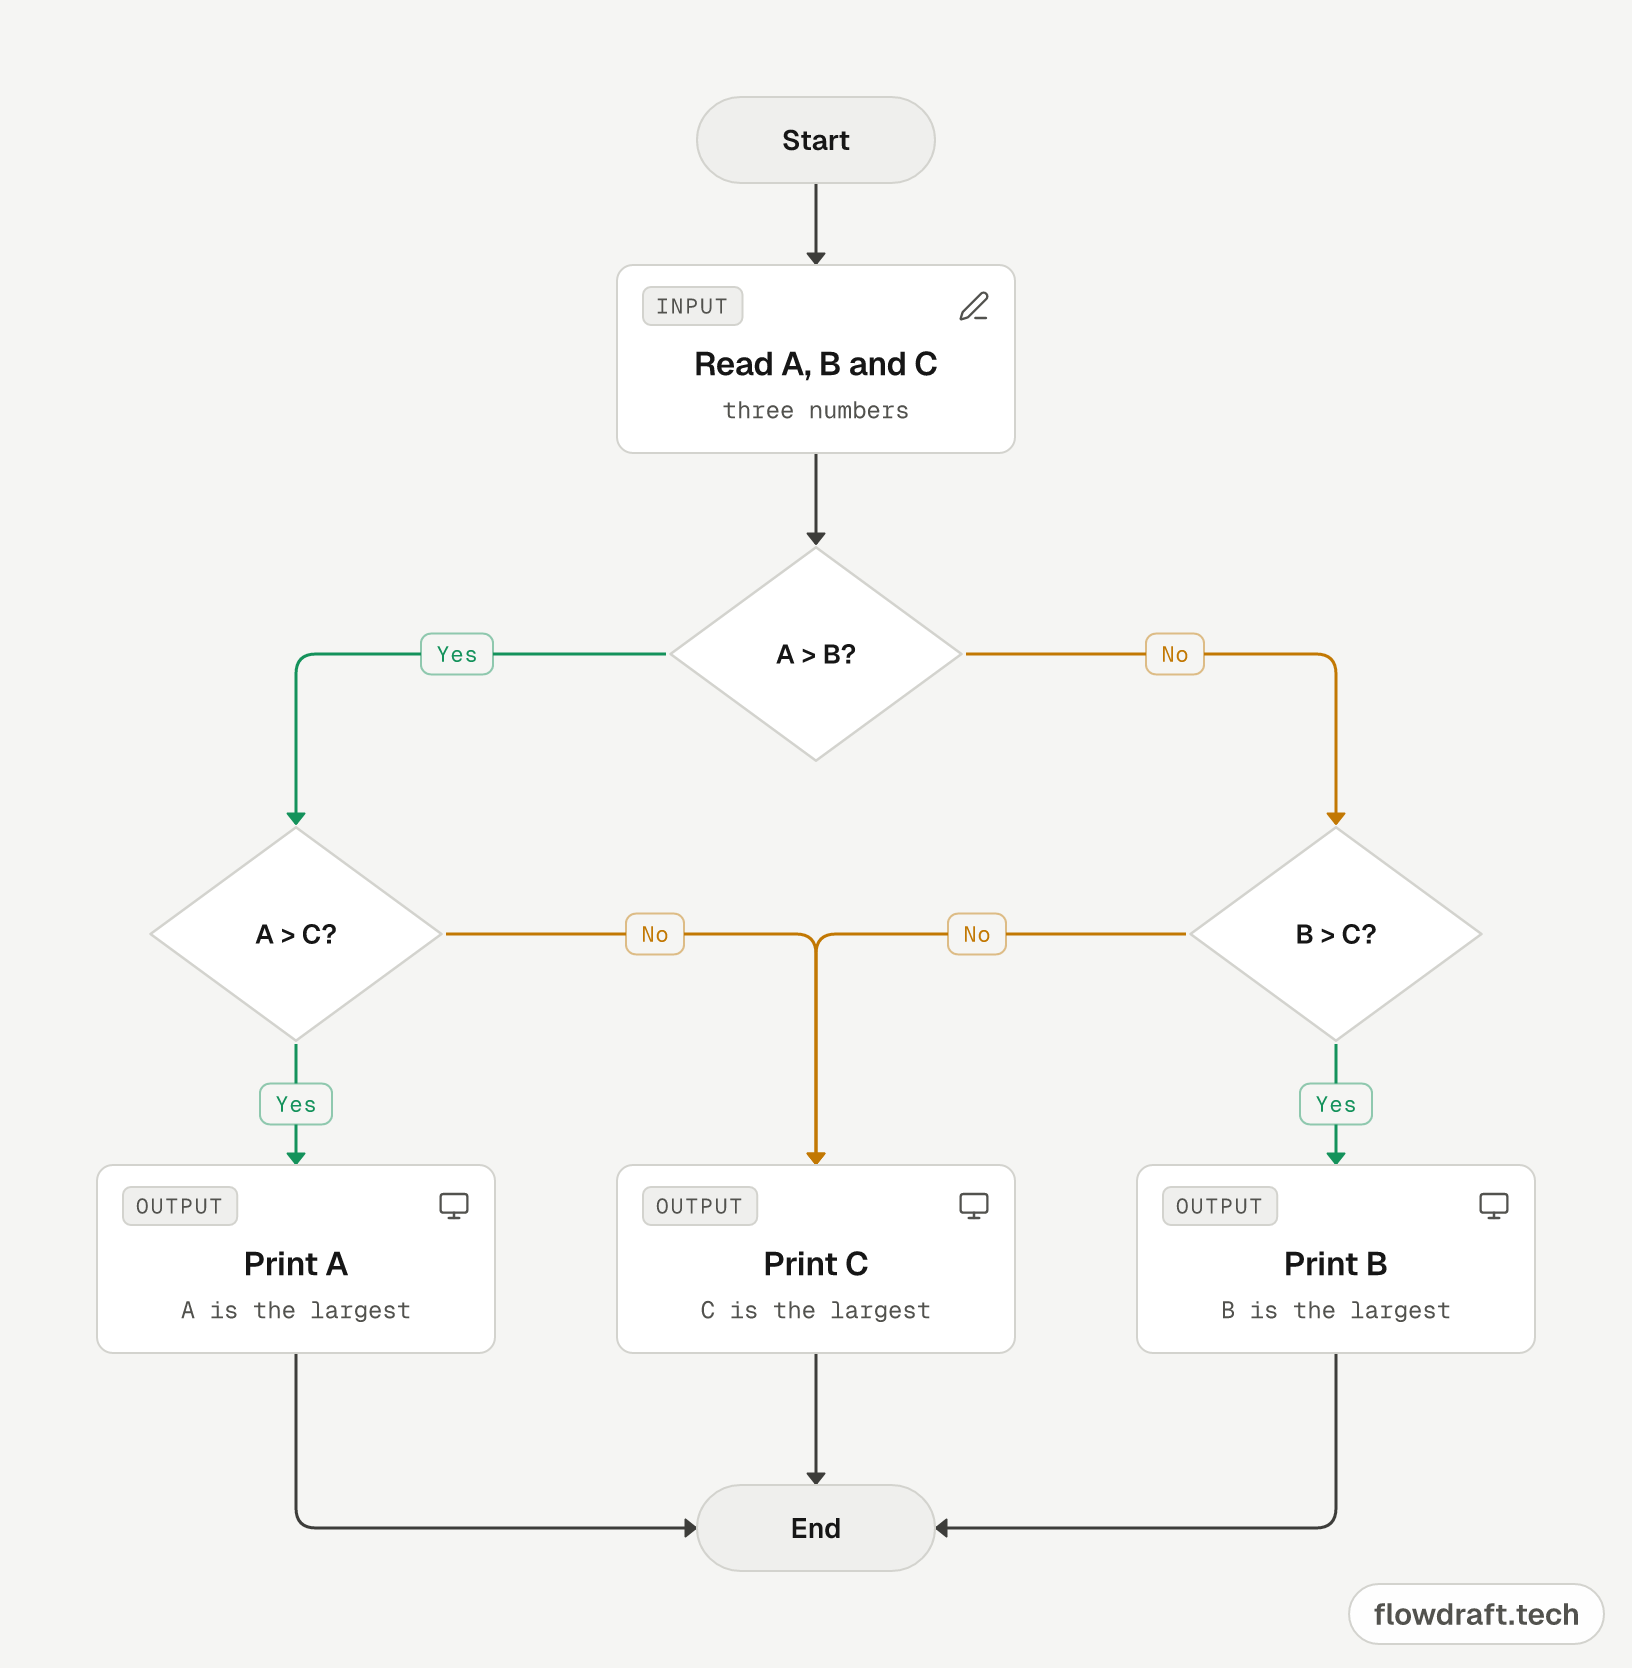
Algorithm
- Step 1: Start
- Step 2: Read A, B and C
- Step 3: If A > B, go to Step 4, otherwise go to Step 5
- Step 4: If A > C, print A, otherwise print C; go to Step 6
- Step 5: If B > C, print B, otherwise print C
- Step 6: End
Walkthrough with A = 7, B = 3, C = 9
- 7 > 3? Yes, so the flow takes the left branch.
- 7 > 9? No, so C is printed: 9.
- The flow ends.
Example 4: Grade average, pass or fail
A student whose average across three exams is 50 or more passes; below 50, they fail. The calculation and the comparison sit in separate boxes, so each box does one job.
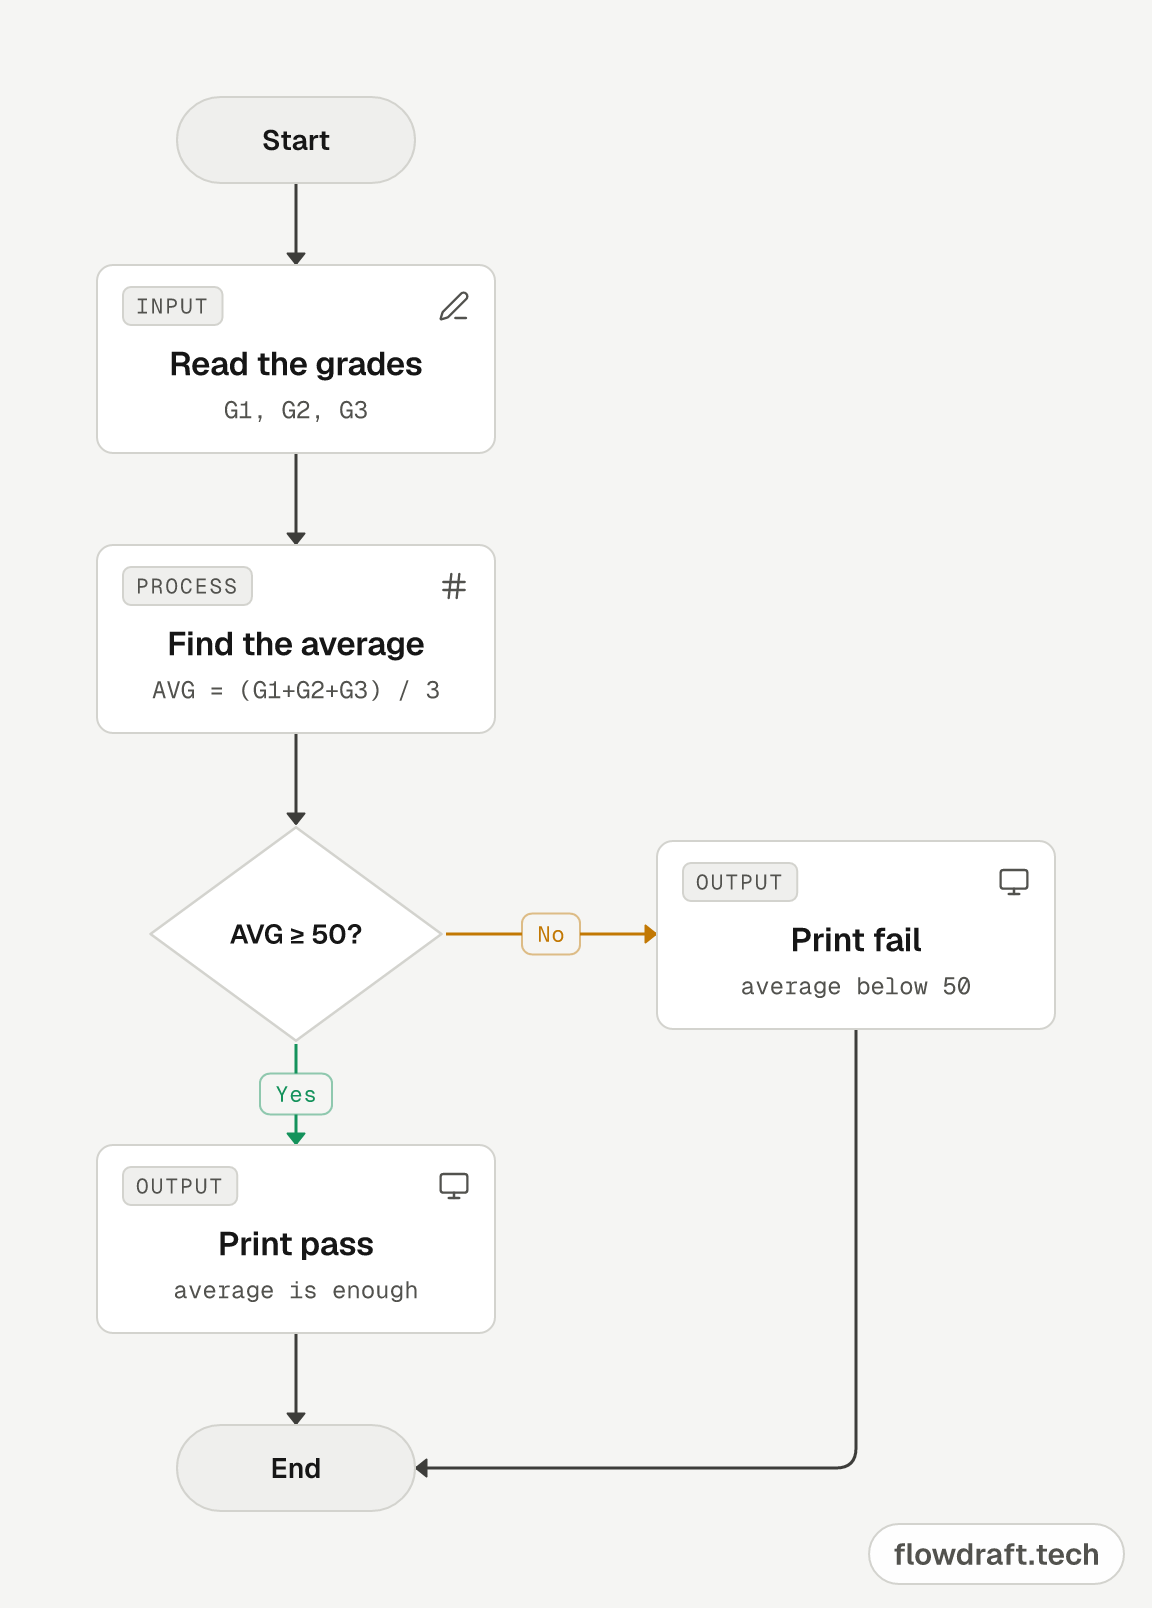
Algorithm
- Step 1: Start
- Step 2: Read G1, G2 and G3
- Step 3: AVG = (G1 + G2 + G3) / 3
- Step 4: If AVG ≥ 50, print “Pass”, otherwise print “Fail”
- Step 5: End
Walkthrough with 40, 55 and 70
- AVG = (40 + 55 + 70) / 3 = 55.
- 55 ≥ 50? Yes, so “Pass” is printed.
Example 5: Sum of the numbers from 1 to N (loop)
The basic loop flowchart. Counter i starts at 1; each pass adds it to the sum and increases it by 1. When “i ≤ N?” turns No, the loop ends and the sum is printed.
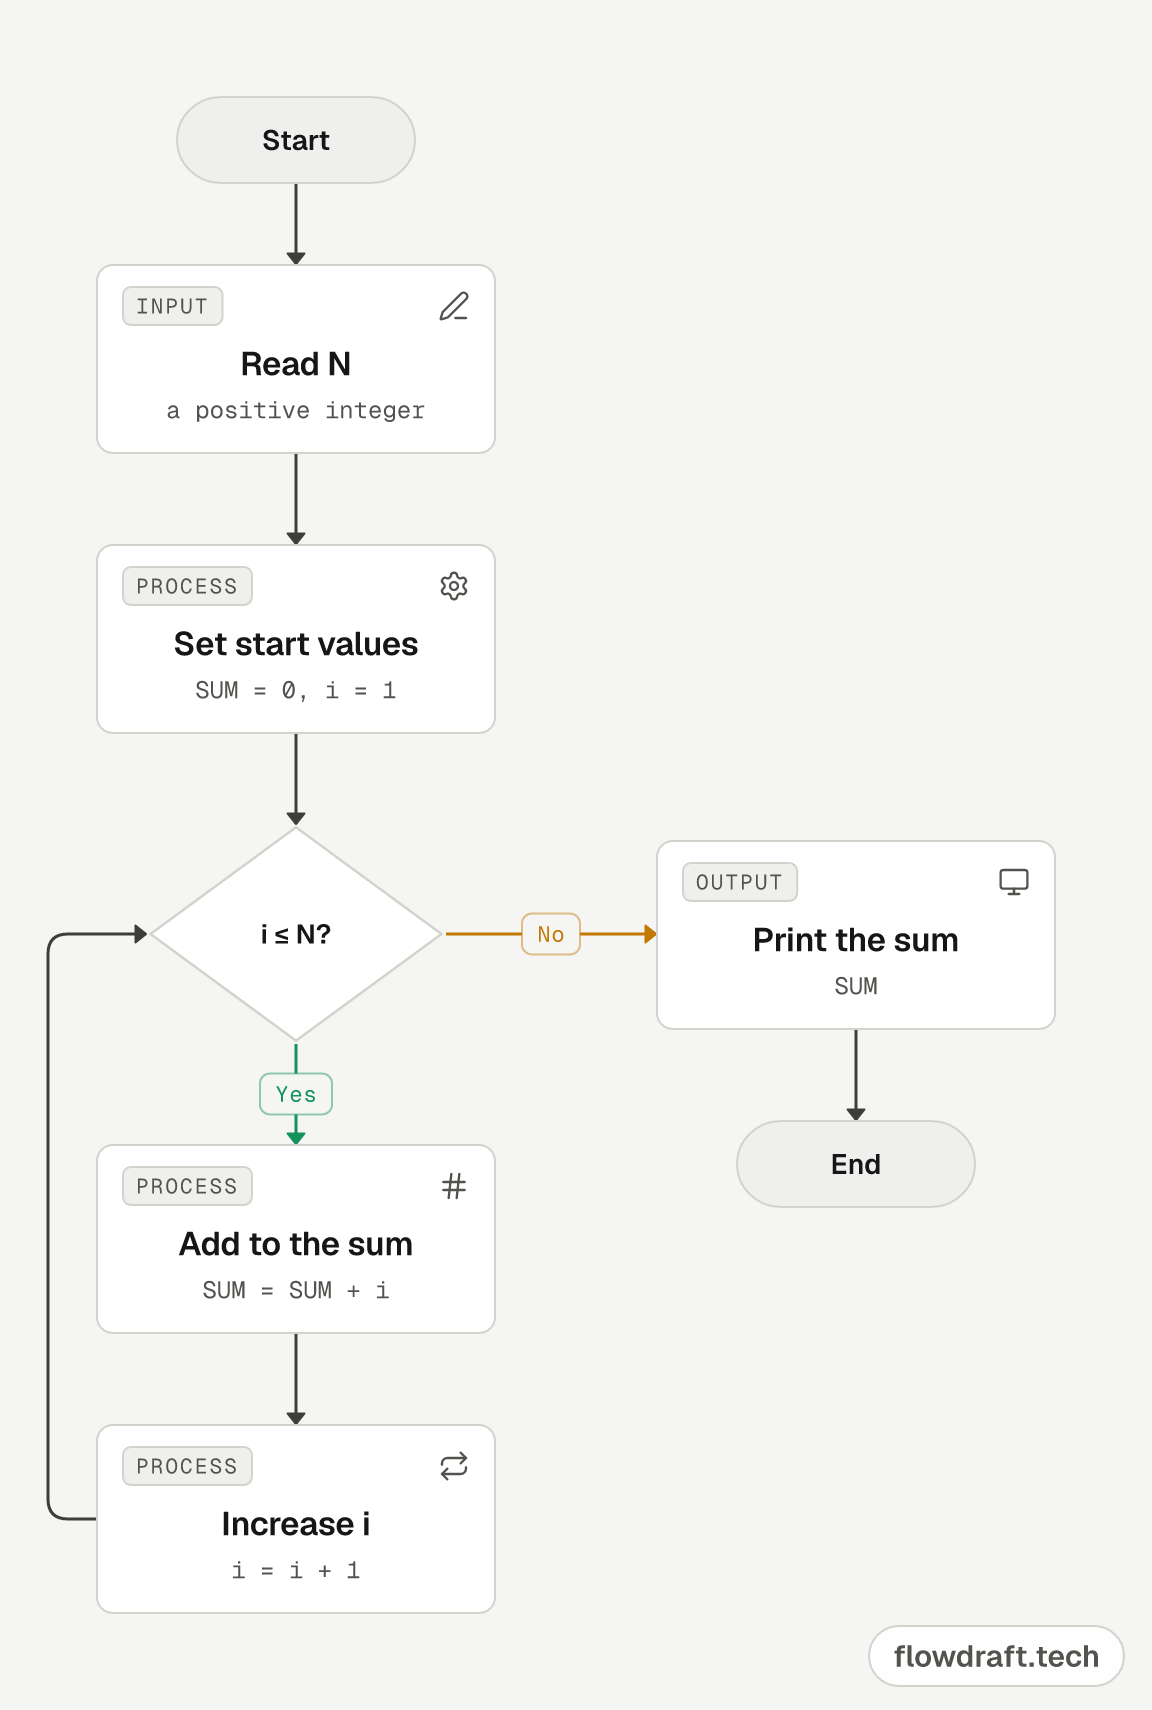
Algorithm
- Step 1: Start
- Step 2: Read N
- Step 3: SUM = 0, i = 1
- Step 4: If i > N, go to Step 7
- Step 5: SUM = SUM + i
- Step 6: i = i + 1, go to Step 4
- Step 7: Print SUM
- Step 8: End
Trace table for N = 4
| Pass | i | i ≤ 4? | SUM |
|---|---|---|---|
| 1 | 1 | Yes | 0 + 1 = 1 |
| 2 | 2 | Yes | 1 + 2 = 3 |
| 3 | 3 | Yes | 3 + 3 = 6 |
| 4 | 4 | Yes | 6 + 4 = 10 |
| – | 5 | No | 10 is printed |
Check: N × (N + 1) / 2 = 4 × 5 / 2 = 10. The formula is quicker, but this example is about the counter and the loop.
Example 6: Factorial flowchart
N! = 1 × 2 × … × N. It is the sum loop with two changes: F starts at 1, not 0 (anything times 0 is 0), and each pass multiplies instead of adding.
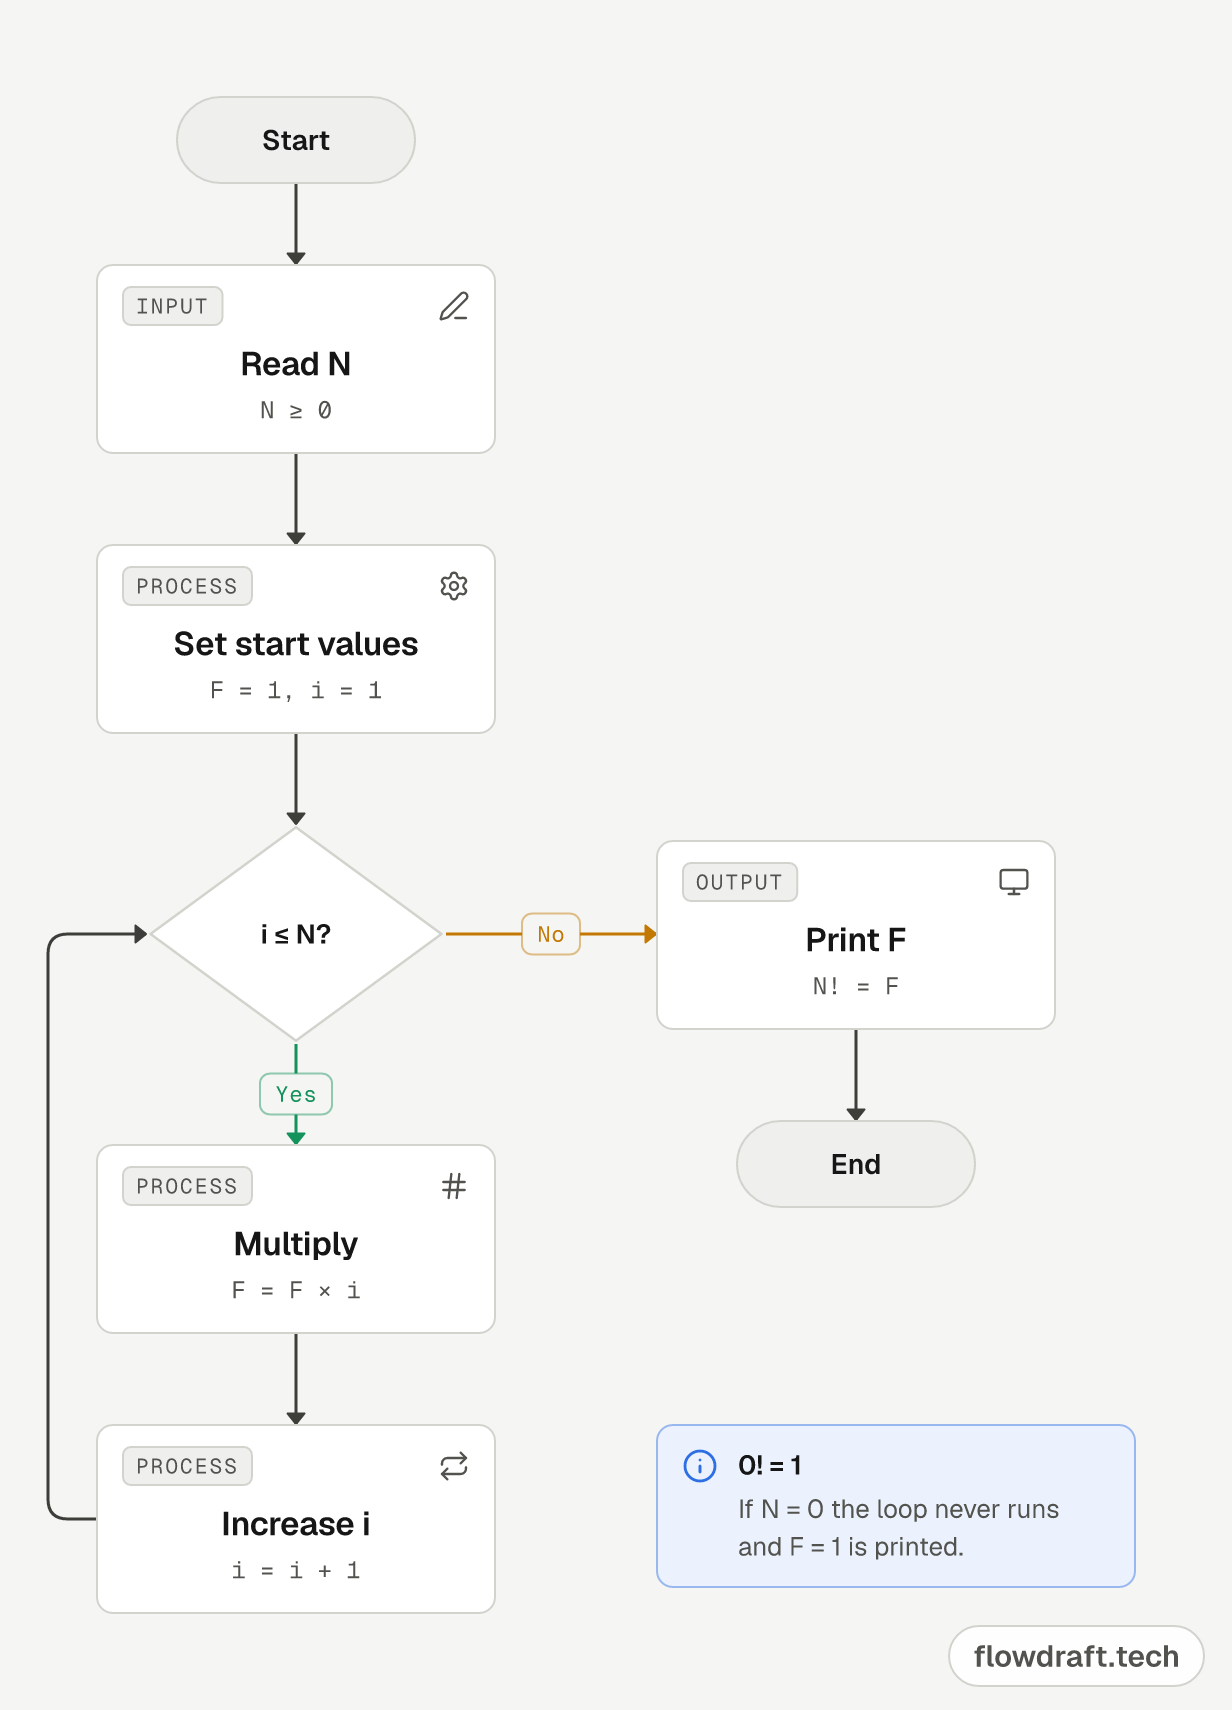
Algorithm
- Step 1: Start
- Step 2: Read N
- Step 3: F = 1, i = 1
- Step 4: If i > N, go to Step 7
- Step 5: F = F × i
- Step 6: i = i + 1, go to Step 4
- Step 7: Print F
- Step 8: End
Trace table for N = 4
| Pass | i | i ≤ 4? | F |
|---|---|---|---|
| 1 | 1 | Yes | 1 × 1 = 1 |
| 2 | 2 | Yes | 1 × 2 = 2 |
| 3 | 3 | Yes | 2 × 3 = 6 |
| 4 | 4 | Yes | 6 × 4 = 24 |
| – | 5 | No | 24 is printed |
Example 7: E-commerce order and shipping (process flowchart example)
Here the steps belong to different parties: the customer, the payment system, the warehouse and the carrier. The card tags show who does what, and the two decisions mark where an order can leave the happy path.
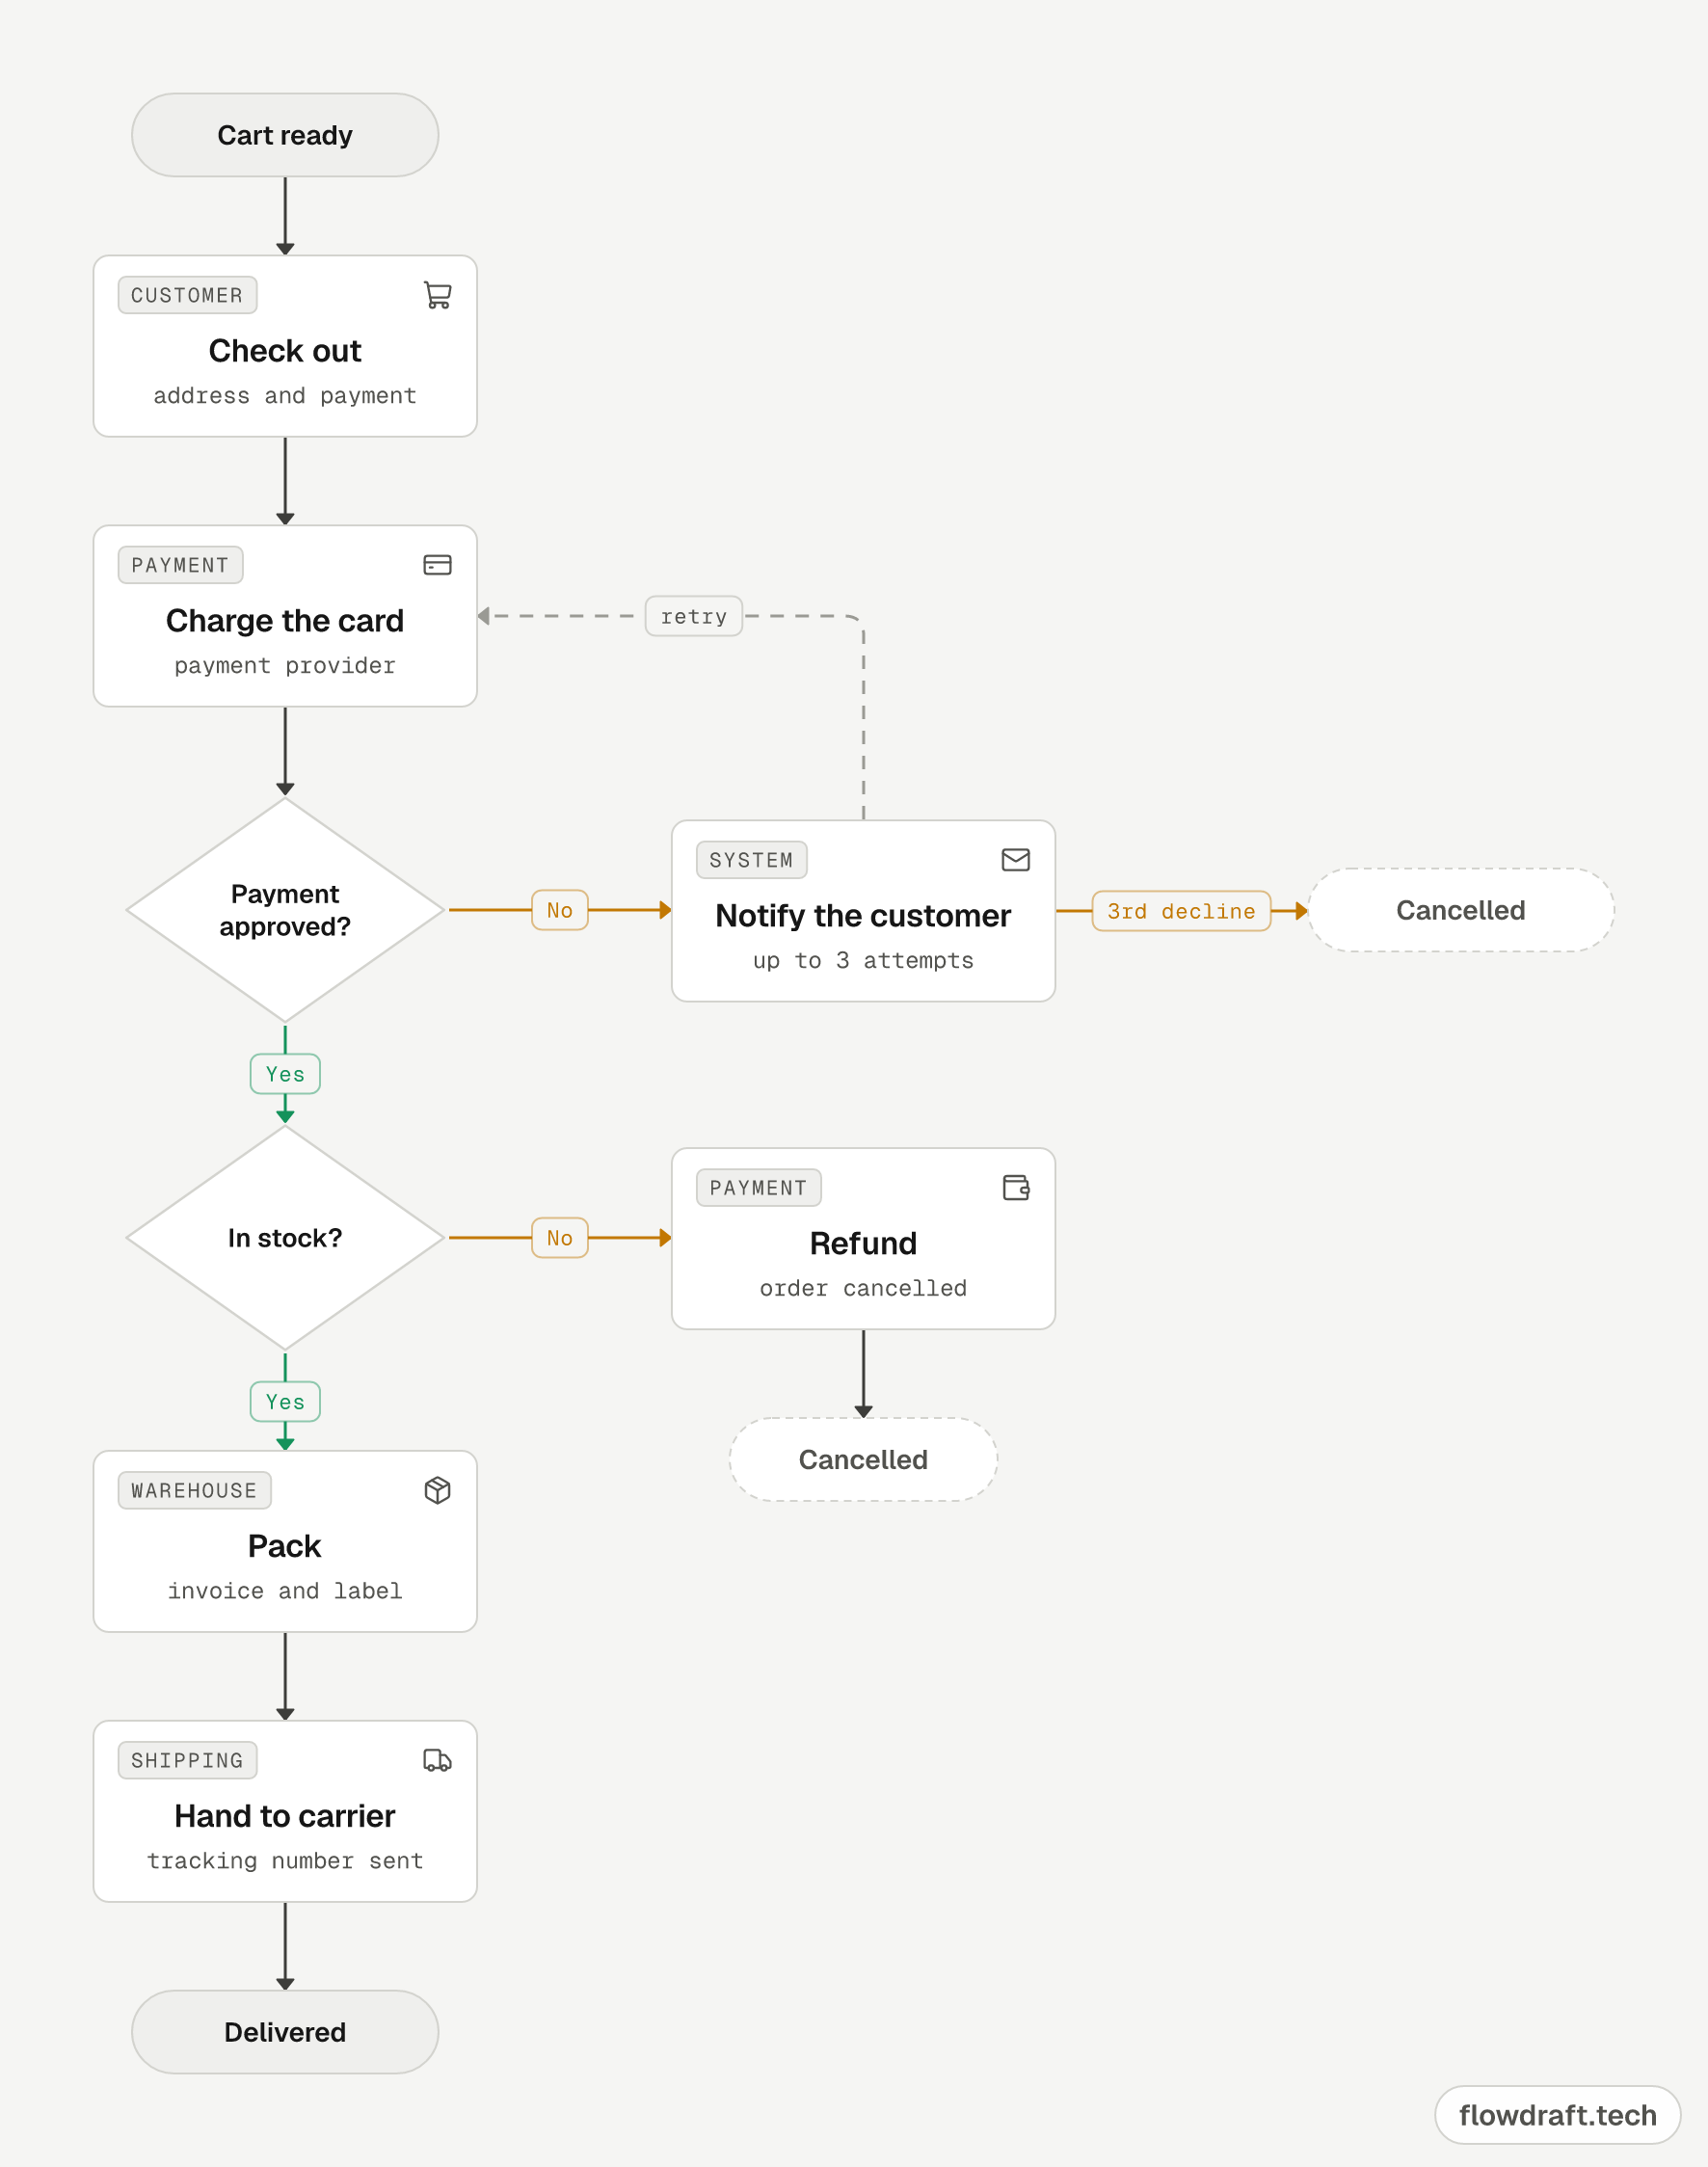
- The customer checks out with an address and payment details.
- The card is charged. If it is declined, the customer is notified and the dashed arrow returns to payment; after the third decline the order is cancelled.
- If the payment is approved, stock is checked; if the item is out of stock, the money is refunded and the order cancelled.
- Otherwise the warehouse packs the order, the carrier picks it up and the customer gets a tracking number.
- The process ends on delivery.
For bigger processes, give each party its own swimlane: add a Lane from the Layout group of the palette and place the cards on it.
Example 8: Support ticket from chatbot to human (workflow diagram example)
This workflow diagram example shows two-tier support: the bot answers first, and if it doesn't know the topic or the customer says the problem isn't solved, a person takes over.
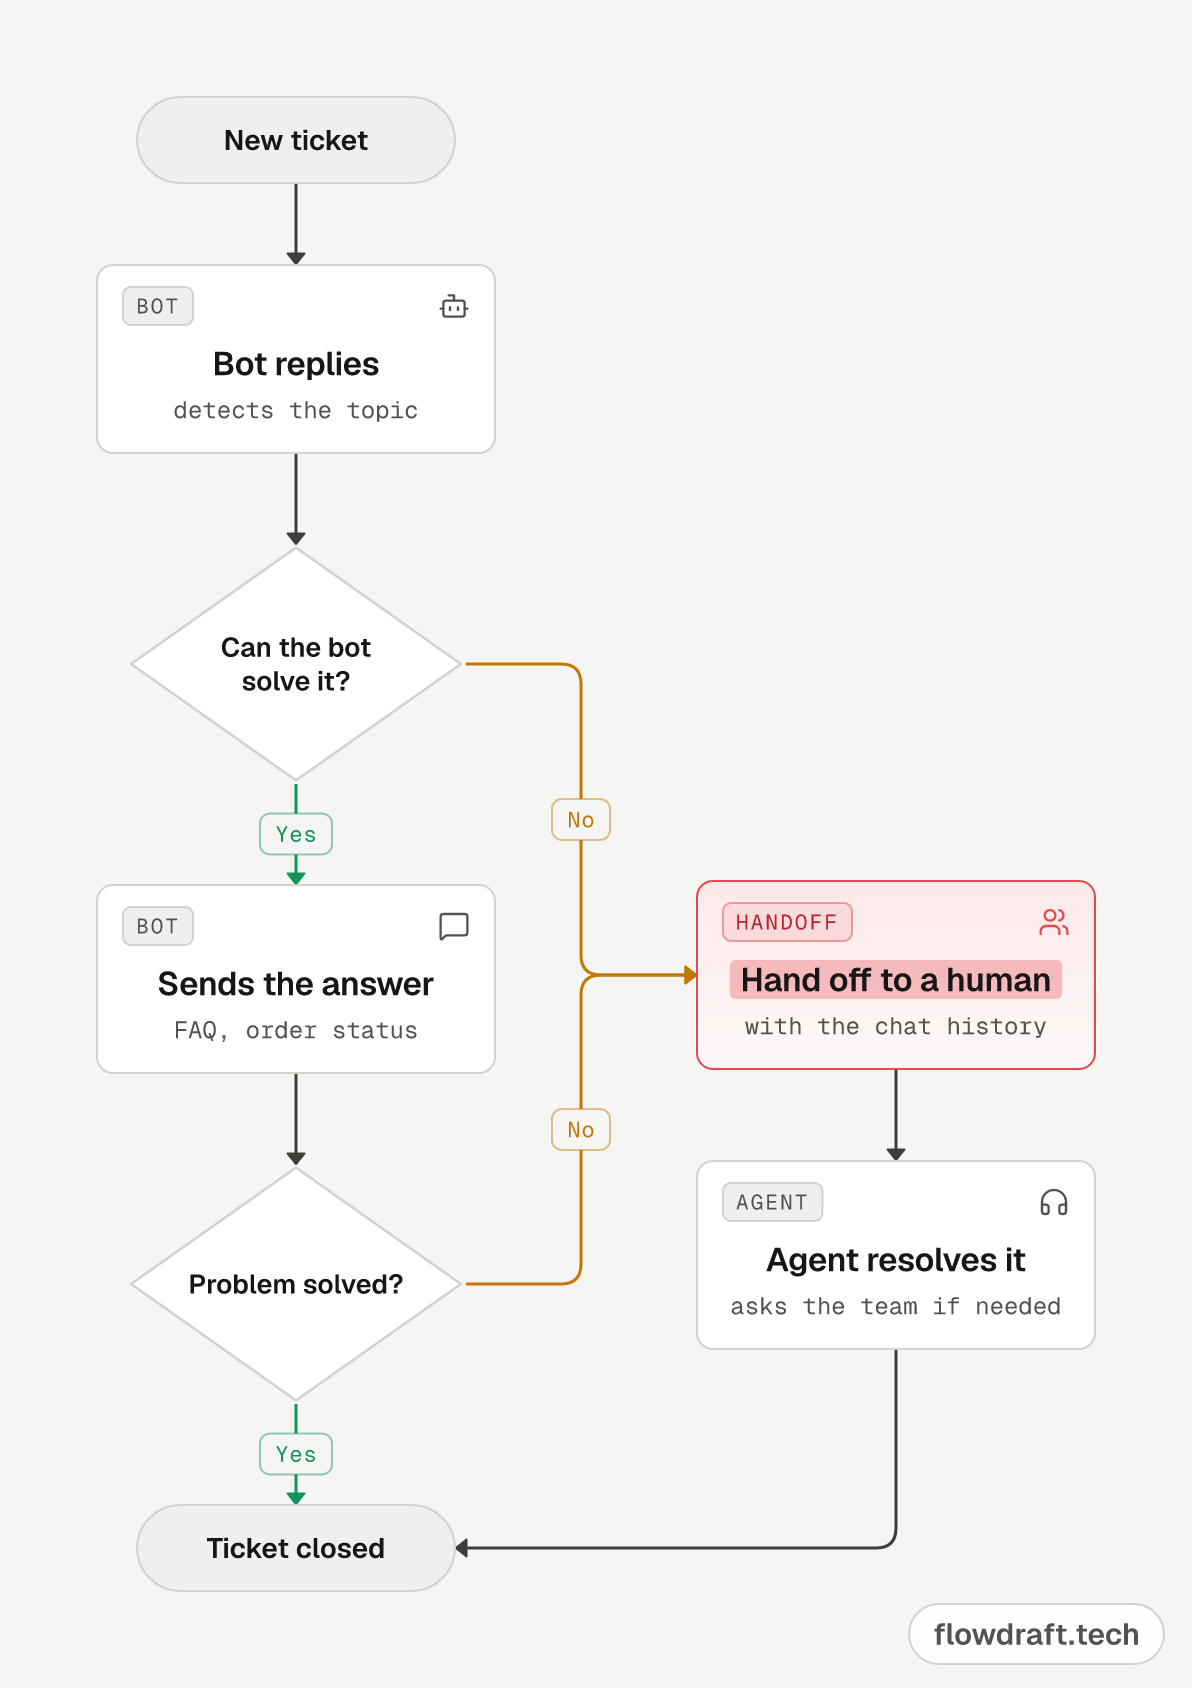
- A ticket arrives and the bot works out the topic, such as order status, returns or passwords.
- If the bot can handle it, it answers from the FAQ or the order system.
- The customer is asked whether the problem is solved; if yes, the ticket closes.
- Otherwise the ticket goes to an agent with the chat history, so the customer doesn't have to repeat everything.
- The agent resolves it and the ticket closes.
Example 9: Login and password reset flow
A flow that almost every software product needs. Failed attempts are counted; the third one locks the account and sends the user to a password reset. The limit and the lock time are example values.
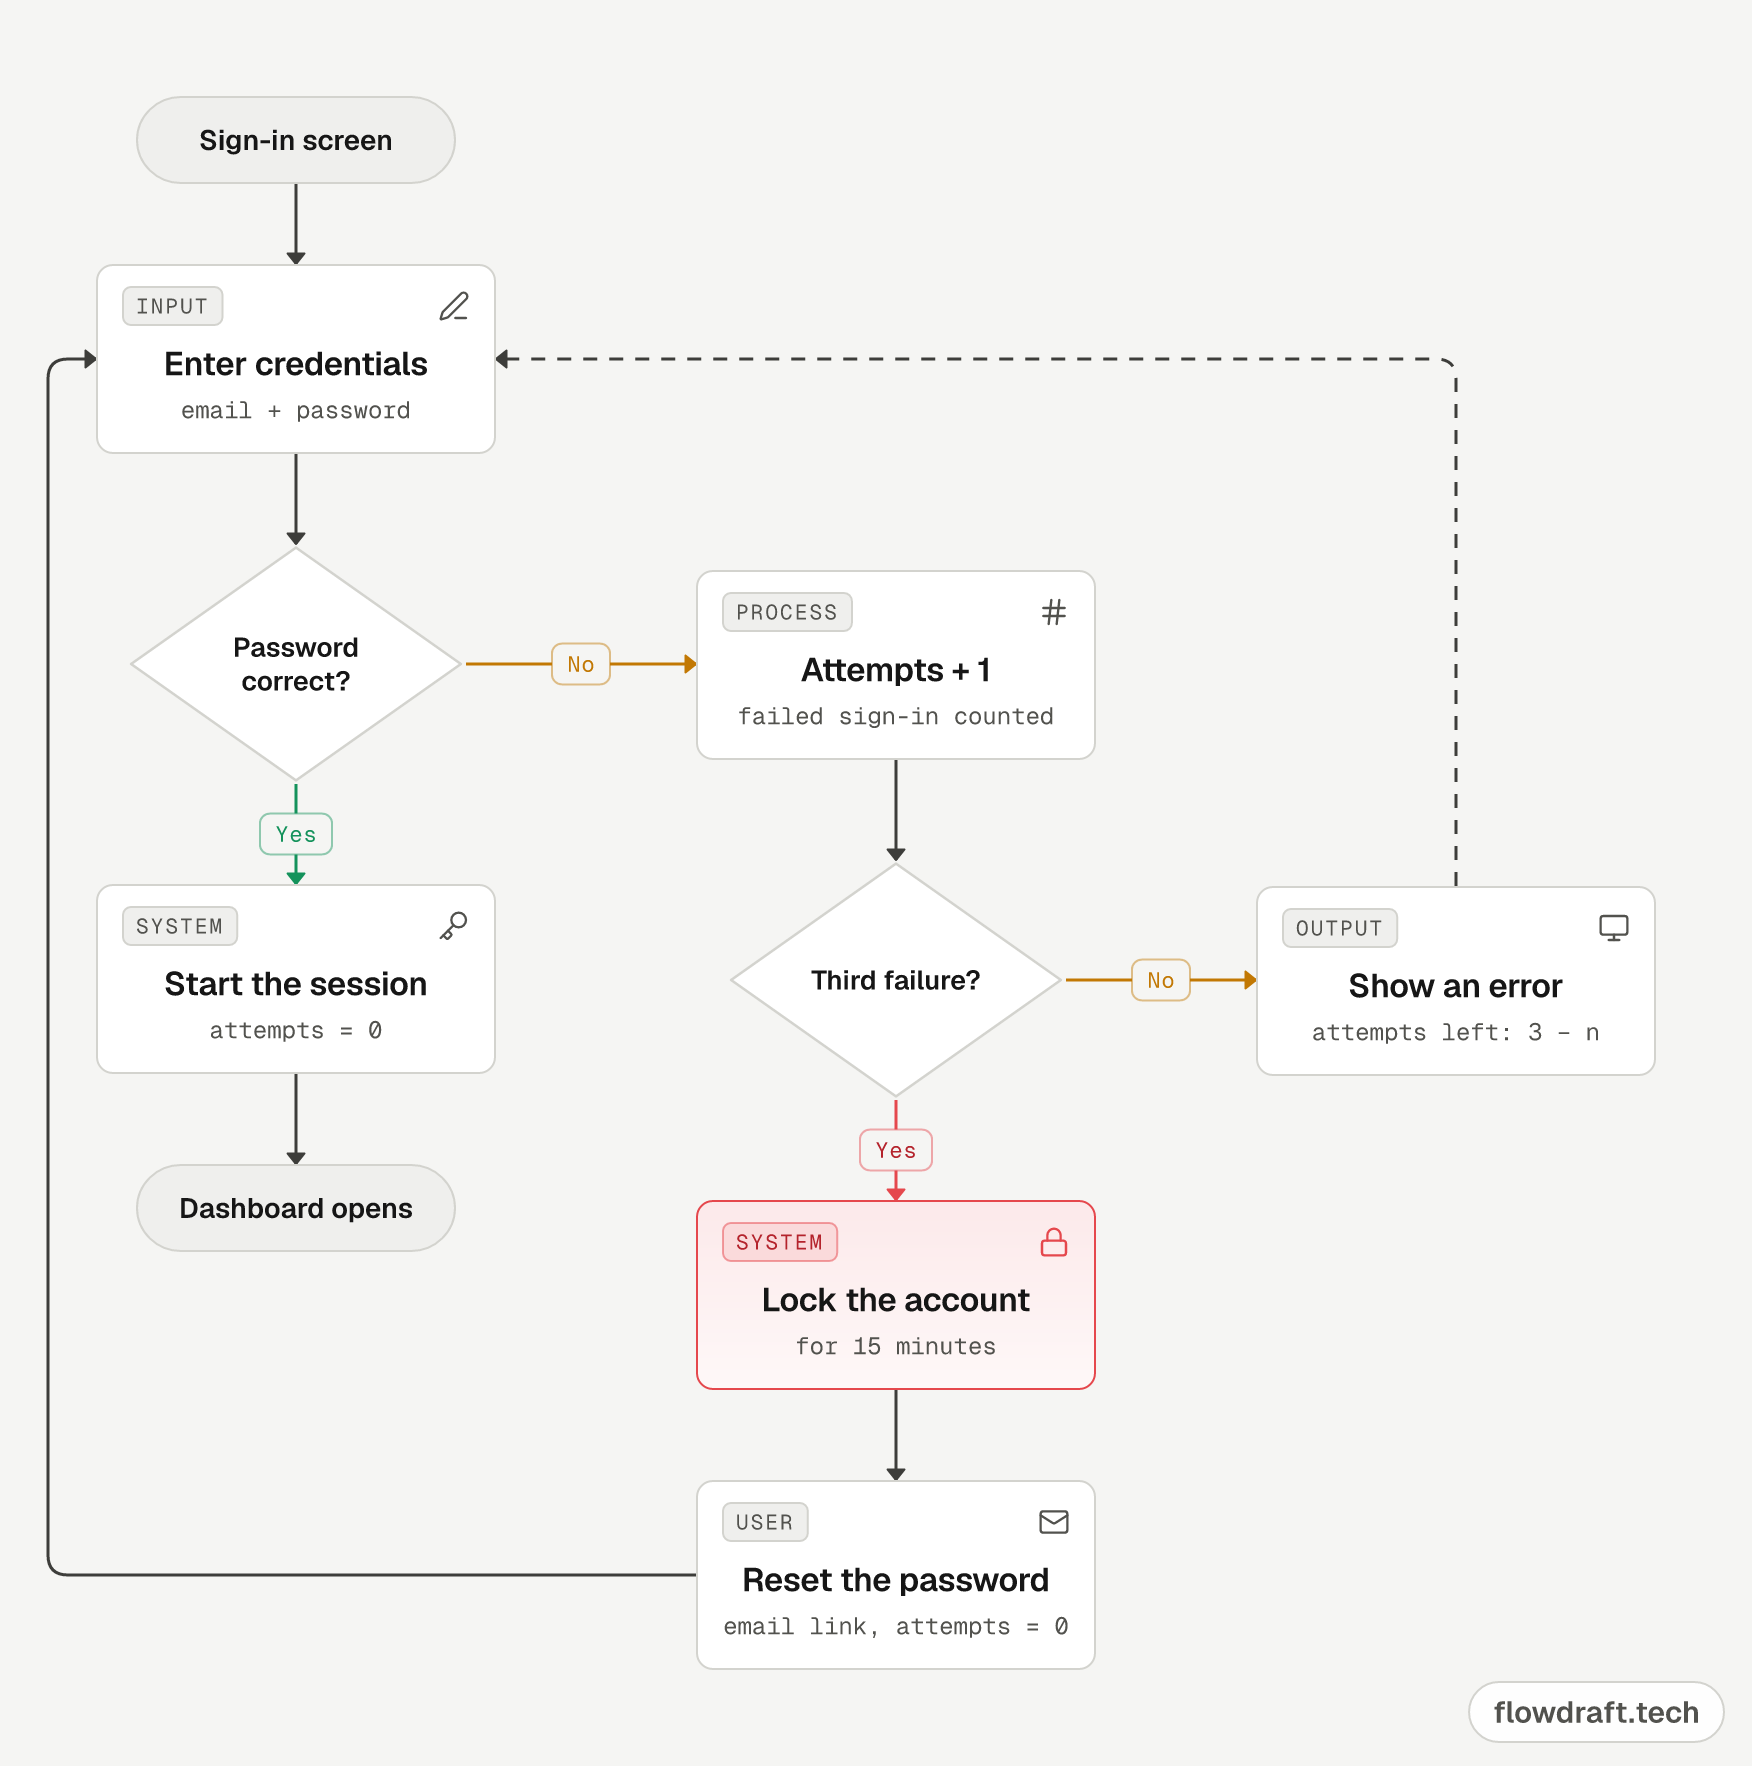
- The user enters an email and password.
- If the password is right, a session starts, the counter resets and the dashboard opens.
- If it is wrong, the counter goes up by 1; before the third failure, the user sees the attempts left and goes back to sign in.
- The third failure locks the account for 15 minutes.
- The user resets the password with the emailed link, the counter goes back to 0 and the flow returns to the sign-in step.
How to write your own algorithm flowchart
- Write the algorithm first: numbered lines from “Step 1: Start” to “End”, one action per line.
- Separate inputs and outputs: what does the user enter, and what gets printed?
- Map lines to symbols: a calculation becomes a process box, “if … otherwise” a decision, read and print become input/output.
- Label both exits of every decision and check that each branch leads somewhere.
- Close the loop: connect the arrow back to the decision and make sure the counter changes on every pass, or the loop never ends.
- Test with a small number: trace it like the tables above and check the result by hand.
In flowdraft, open the editor, drag parts from the palette onto the canvas and connect boxes by dragging from the dots on their edges. Drawing needs no account; a free account adds cloud save, auto-save and export. The 30-second tour shows the rest.
Steps written but no time to draw? Connect flowdraft to ChatGPT or Claude and the AI draws the flowchart in your account; see the ChatGPT flowchart guide.
Frequently asked questions
What is the difference between an algorithm and a flowchart?
An algorithm is the written list of steps that solves a problem; a flowchart draws the same steps with symbols and arrows. Writing the algorithm first makes the flowchart easier to get right.
What is a trace table in a flowchart?
A table that lists each variable's value after every pass of a loop, like the N = 4 tables above; it is the quickest way to check a flowchart by hand.
How do you check if a number is even in a flowchart?
Use a decision such as “N mod 2 = 0?”: Yes means even, No means odd.
How do you find the largest of three numbers in a flowchart?
Read A, B and C and ask “A > B?”. Compare the larger of the two with C in a second decision (“A > C?” or “B > C?”) and print the winner. Every path asks just two questions.
Why does the factorial flowchart start F at 1?
1 is the neutral value for multiplication, so the first pass gives F = 1 × 1 and 0! also comes out as 1.
Can I edit these flowchart examples and download them?
Yes. Open any example with the button under it and change what you like; downloading it as PNG, SVG or JSON requires a free account.
Can AI draw a flowchart for me?
Yes. Add the flowdraft MCP server (https://flowdraft.tech/mcp) to ChatGPT, Claude, Claude Code, Cursor or VS Code, sign in and approve access, and the AI draws flowcharts in your account. Claude and ChatGPT also show a picture of the result in the chat.